Tutorial
On the use of R and its MCDA package
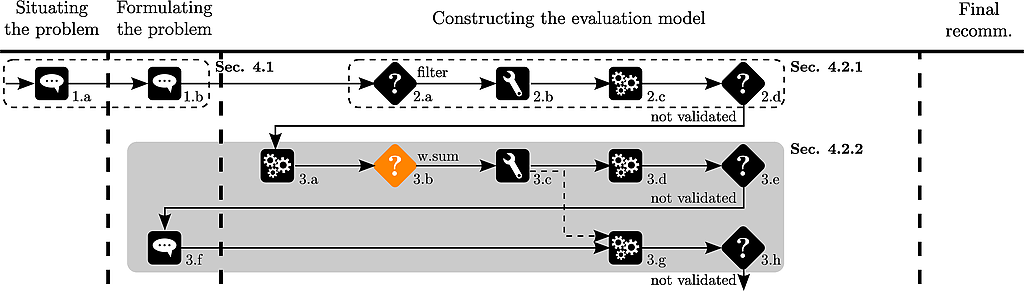
The example of this tutorial is from Chapter 6 of [Bouyssou et al., 2000], but in order to illustrate all the steps which we wish to highlight, we take the liberty of slightly modifying the original description.
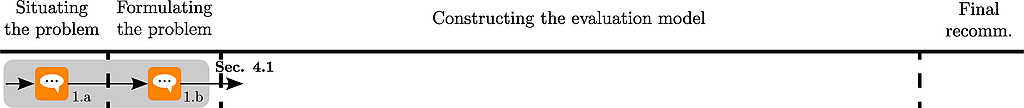
The problem takes place in 1993, when Thierry, a student aged 21, is passionate about sports cars and wishes to buy a middle range, 4 years old car with a powerful engine. He asks an analyst to help him to find the best alternative for his needs. We will play the role of the analyst in this decision aiding process. In a first step, we identify the alternatives and the criteria in a dialogue with Thierry. Three points of view appear to be important to Thierry, which are expressed through five criteria: cost point of view (criterion g1), performance of the engine point of view (criteria g2 and g3) and safety point of view (criteria g4 and g5). The list of alternatives and their evaluations on these five criteria is provided as a data file in the MCDA R package. Thierry is then asked to express the preferential direction on each of the criteria. He considers that the “cost” criterion (euro) and the performance criteria “acceleration” (seconds) and “pick up” (seconds) have to be minimized, whereas the safety criteria “brakes” and “road-hold” have to be maximized. The values of the latter two criteria are average evaluations obtained from multiple qualitative evaluations which have been re-coded as integers between 0 and 4. Further details on these data can be found in.
Note that, in comparison to the original data set of [Bouyssou et al., 2000], we removed alternative a10, as it will be used later in our decision aiding scenario.
To load the data :
# load performance table csv file
# provided with the MCDA package

f <- system.file("datasets","performanceTable2.csv",package="MCDA")

pT <- read.csv(file = f, header=TRUE, row.names=1)
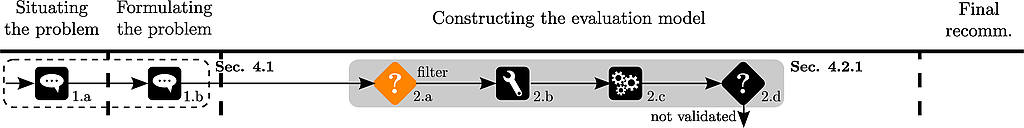
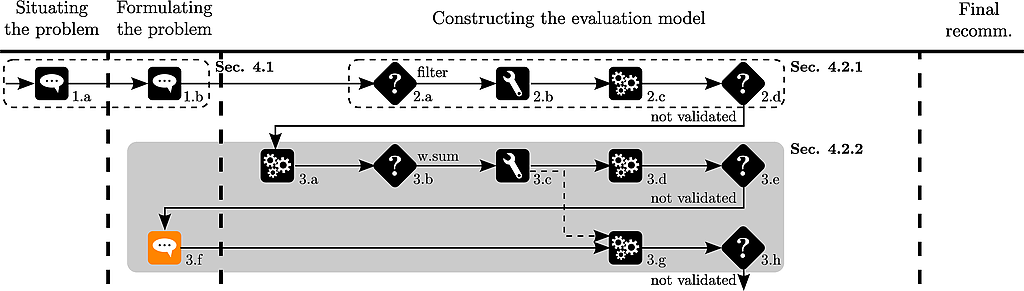
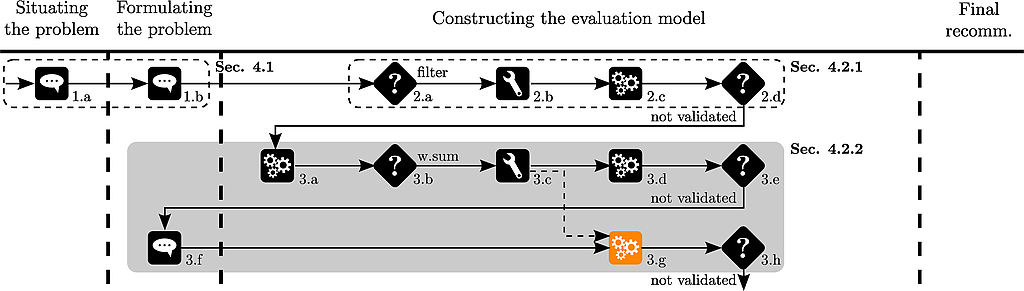
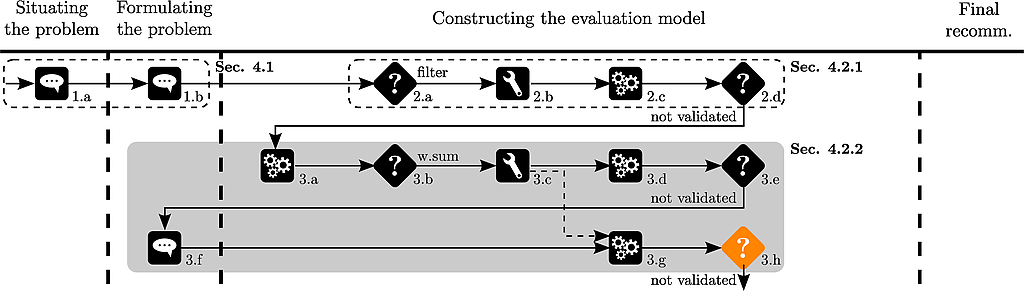
Thierry first wishes to apply some filtering rules :
- brakes (g4) >= 2
- road-hold (g5) >= 2
- acceleration (g2) < 30
and to drop car a14, because it is dominated by a11.
# filter out cars which do not
# respect Thierry's initial rules

fPT <- pT[(pT$g4>=2 & pT$g5>=2 & pT$g2 < 30), ]

# drop car a14 from the table

fPT <- fPT[!(rownames(fPT) %in% "a14"), ]
Now Thierry wants to see the filtered performance table :
     g1   g2   g3   g4   g5
a03  16973 29.0 34.9 2.66 2.50
a07  18971 28.0 35.6 2.33 2.00
a11  17537 28.3 34.8 2.33 2.75
a12  15980 29.6 35.3 2.33 2.75
as well as its graphical representation :
criteriaMinMax <- c("min","min","min","max","max")

names(criteriaMinMax) <- colnames(pT)

plotRadarPerformanceTable(fPT, criteriaMinMax, overlay=FALSE, bw=TRUE, lwd =5)
which produces :
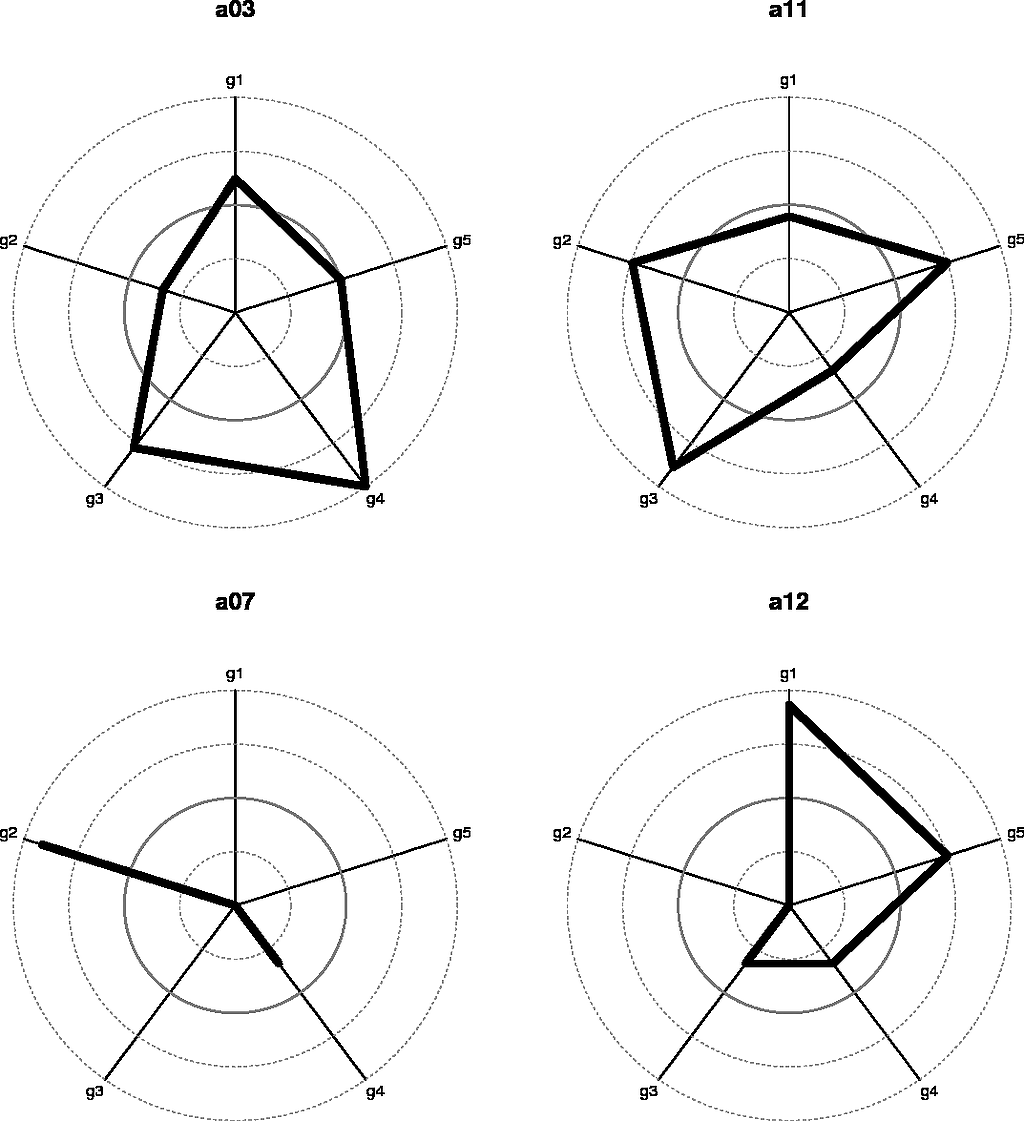
After seeing this plot, Thierry thinks that this filtering is too restrictive.
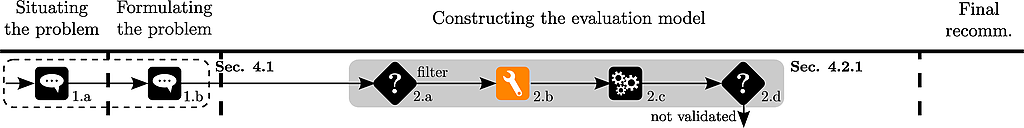
The analyst wishes to show Thierry bar-charts of the evaluations of the alternatives :
par(mfrow=c(2,3))
for (i in 1:dim(pT)[2]){
        yaxis <- range(pT[,i])*c(0.99,1.05)
        if (criteriaMinMax[i] =="min")
                oPT <- pT[order(pT[,i],decreasing=FALSE),]
        else
                oPT <- pT[order(pT[,i],decreasing=TRUE),]
        name <-paste(colnames(pT)[i]," (",criteriaMinMax[i],")", sep="")
        barplot(oPT[,i], main=name, names.arg = rownames(oPT),
        density = i*10, ylim = yaxis, xpd=FALSE)
Which produces :
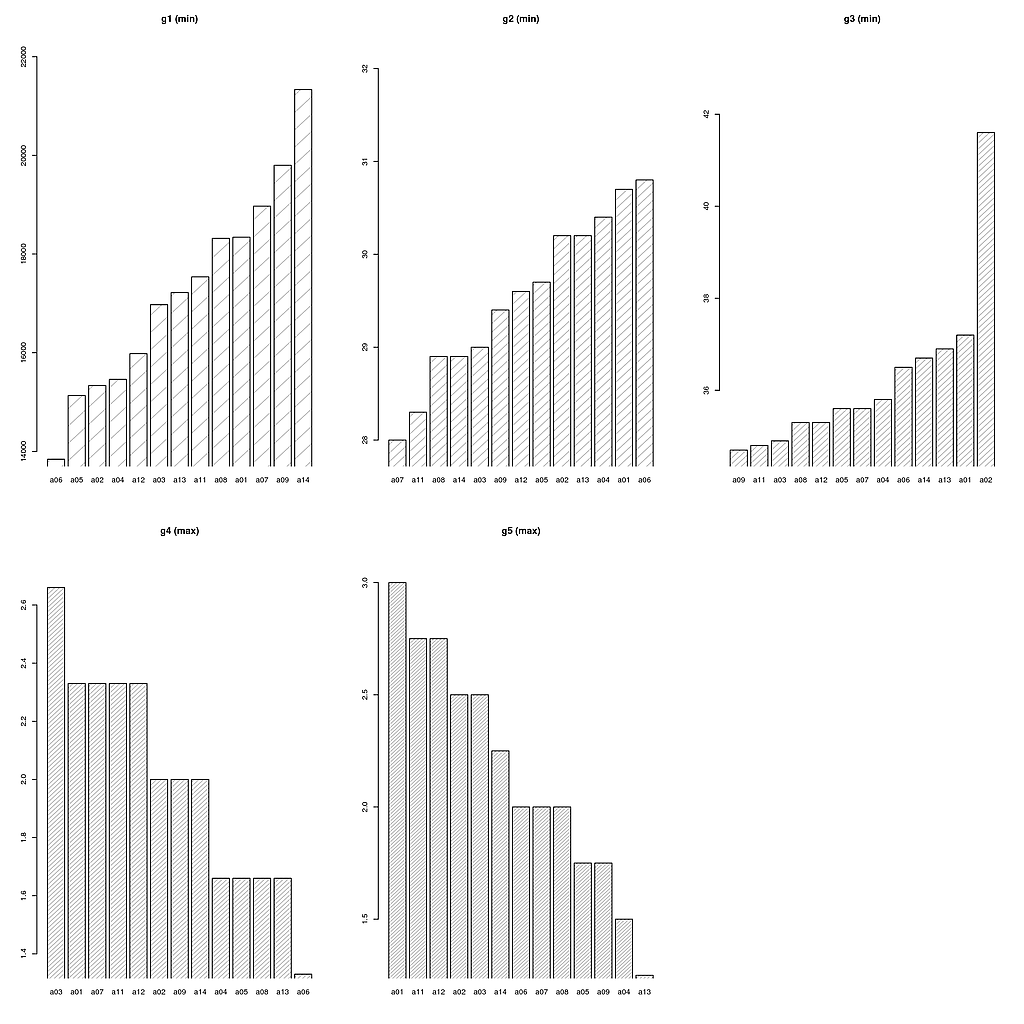
Thierry observes :
- that alternative a11 (P309-16) seems to be a good alternative
- it performs well on many of criteria (except g1 (price))
- the rather bad performance on the price criterion could be compensated by the good performances in the other criteria
- Thierry heard about the weighted sum in his lectures …
The analyst suggests to use a weighted sum to aggregate the various evaluations of the alternatives on the criteria.
We start by normalizing the data :
# normalization of the data from the performance table

normalizationTypes <- c("percentageOfMax","percentageOfMax","percentageOfMax",
                                        "percentageOfMax","percentageOfMax")

names(normalizationTypes) <- c("g1","g2","g3","g4","g5")

nPT <- normalizePerformanceTable(pT,normalizationTypes)
Thierry gives some more or less arbitrary weights of the criteria :
- g1 : -1
- g2 : -2
- g3 : -1
- g4 : 0.5
- g5 : 0.5
The analyst then calculates the weighted sum of the evaluations :
w <- c(-1,-2,-1,0.5,0.5)
names(w) <- colnames(pT)
ws<-weightedSum(nPT,w)
And the ranks of the alternatives :
# rank the scores of the alternatives
rank(-ws)
Which outputs :
a01 a02 a03 a04 a05 a06 a07 a08 a09 a11 a12 a13 a14
5    6   2  10   7   9   4   8  11   1   3  13  12
Thierry observes that a11 is ranked before a03.
A new car is discovered by Thierry (a10 of the original data set). Its price equals 16966, its acceleration 30, its pick up 37.7, its road-hold 2.33 and its brakes 3.25.
The analyst adds the car to the performance table :
# add supplementary car to pT

missing <- c(16966,30,37.7,2.33,3.25)
pT<-rbind(pT,missing)
rownames(pT)[14] <- "a10"
He normalizes the data and applies again the weighted sum :
nPT <- normalizePerformanceTable(pT,normalizationTypes)
ws<-weightedSum(nPT,w)
and shows the ranking of the cars to Thierry :
# rank the scores of the alternatives
rank(-ws)
which produces :
a01 a02 a03 a04 a05 a06 a07 a08 a09 a11 a12 a13 a14 a10
6   8   1  11   7  10   5   9  12   2   3  14  13   4
Thierry observes that a03 is ranked before a11.
This rank reversal disturbs Thierry.
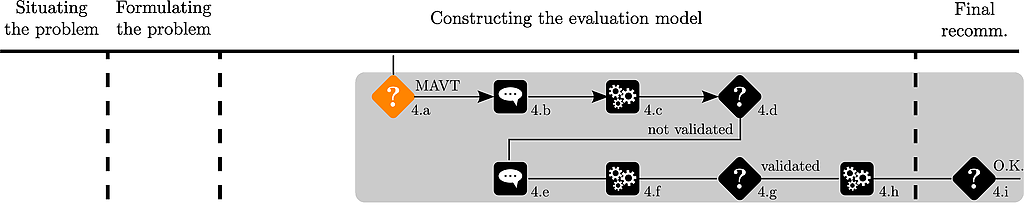
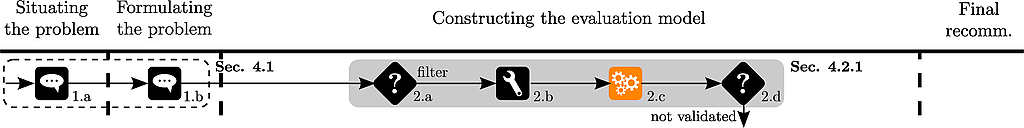
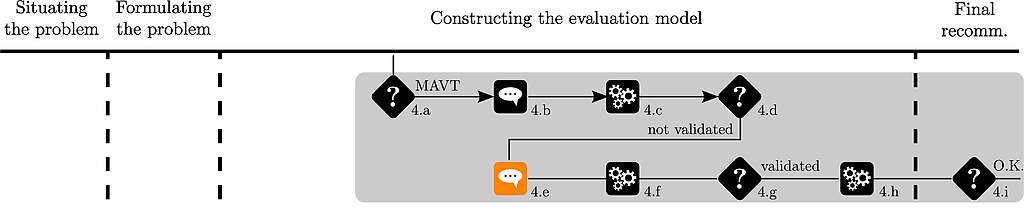
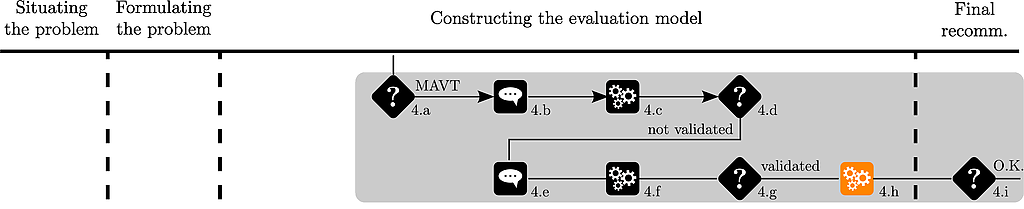
The analyst suggests to use an aggregation method independent of the underlying data and chooses to use an additive model.
Due to his interest in sports cars, Thierry has some a priori preferences on a few alternatives.
He ranks 5 cars as follows :
a11 > a03 > a13 > a09 > a14
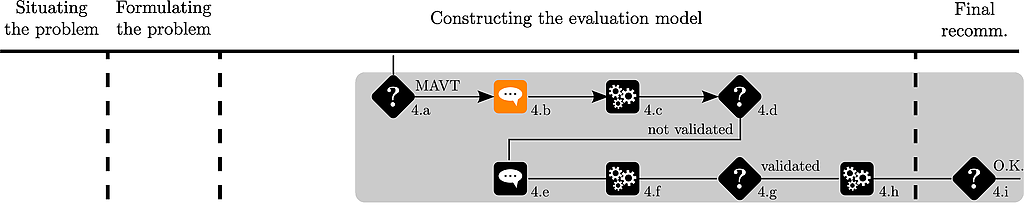
The analyst uses the UTA method to identify value functions respecting this ranking :
# ranks of the alternatives

alternativesRanks <- c(1,2,3,4,5)
names(alternativesRanks) <- c("a11","a03","a13","a09","a14")

# number of break points for each criterion : 1 segment = 2 breakpoints

criteriaNumberOfBreakPoints <- c(2,2,2,2,2)
names(criteriaNumberOfBreakPoints) <- colnames(pT)

# lower and upper bounds of the criteria for the determination of value functions

criteriaLBs=apply(pT,2,min)
names(criteriaLBs) <- colnames(pT)

criteriaUBs=apply(pT,2,max)
names(criteriaUBs) <- colnames(pT)

# the separation threshold

epsilon <-0.01

# UTA elicitation

x<-UTA(pT, criteriaMinMax,
           criteriaNumberOfBreakPoints, epsilon,
           alternativesRanks = alternativesRanks,
           criteriaLBs = criteriaLBs, criteriaUBs = criteriaUBs)
The output of UTA gives :
$optimum
[1] 0

$valueFunctions
$valueFunctions$g1
[,1]        [,2]
x 21334 1.38410e+04
y     0 4.61114e-01

[...]

$overallValues
a03     a09     a11     a13     a14
0.67611 0.38286 0.68611 0.39286 0.31252

$ranks
a03 a09 a11 a13 a14
2   4   1   3   5

$errors
a03 a09 a11 a13 a14
0   0   0   0   0

$Kendall
[1] 1
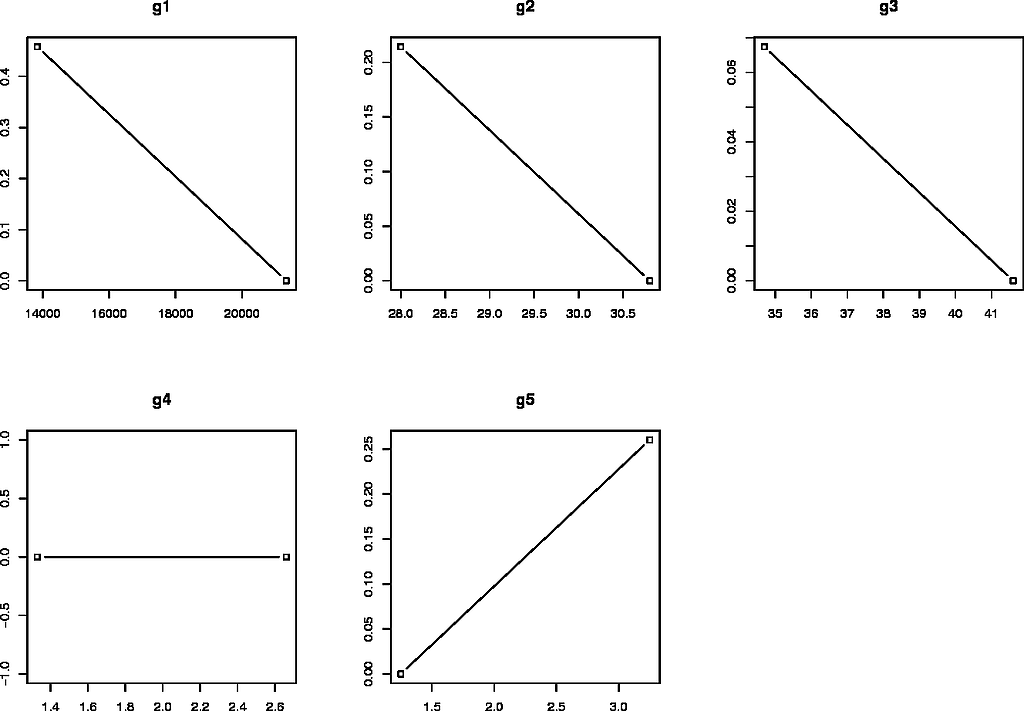
The analyst then plots the value functions for Thierry :
# plot the piecewise linear value functions

plotPiecewiseLinearValueFunctions(x$valueFunctions)
which are shown here :
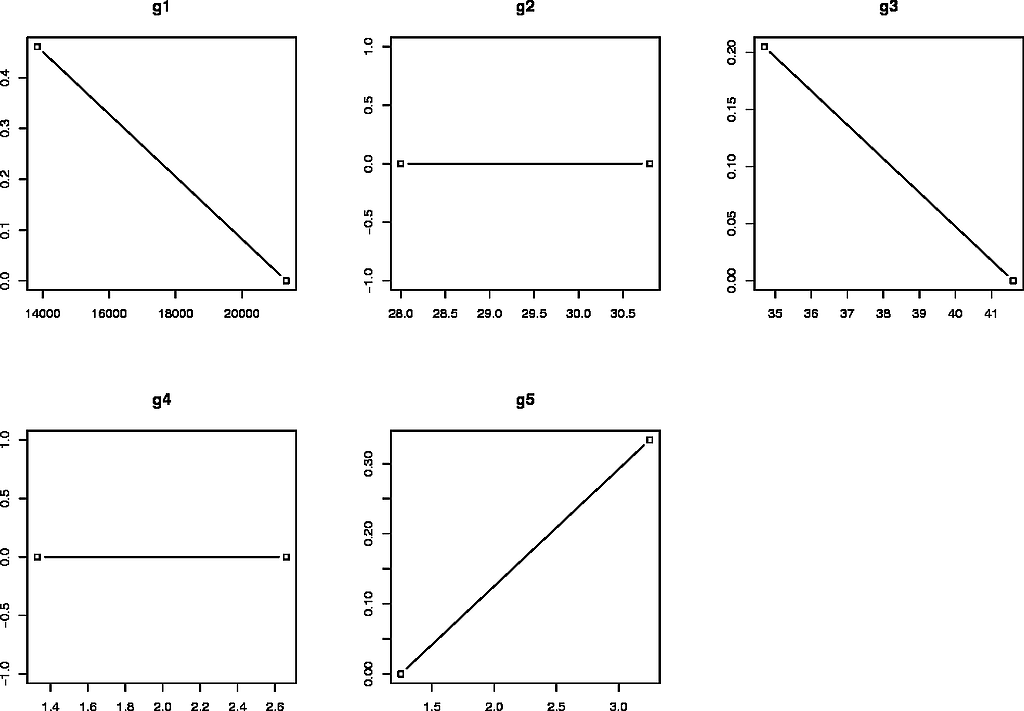
Thierry considers that acceleration (g2) should play a role when discriminating between alternatives
Thierry adds a new alternative (a08) to his ranking :
a11 > a03 > a08 > a04 > a13 > a09 > a14.
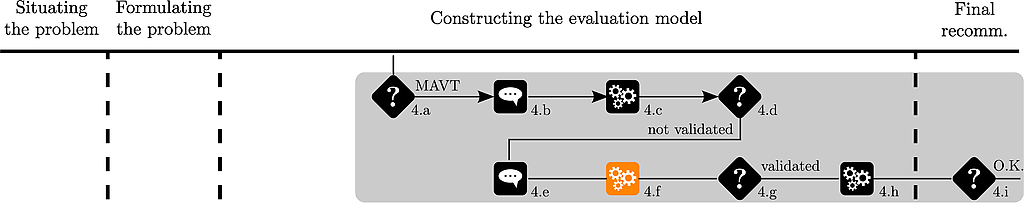
Second try with UTA :
# ranks of the alternatives for the second try

alternativesRanks <- c(1,2,3,4,5,6,7)
names(alternativesRanks) <- c("a11","a03","a08","a04","a13","a09","a14")

x2<-UTA(pT, criteriaMinMax,
           criteriaNumberOfBreakPoints, epsilon,
           alternativesRanks = alternativesRanks,
           criteriaLBs = criteriaLBs, criteriaUBs = criteriaUBs)
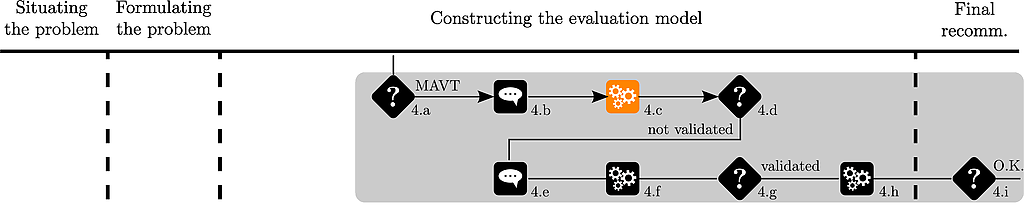
The analyst plots again the piecewise value functions :
# plot the piecewise linear value functions

plotPiecewiseLinearValueFunctions(x2$valueFunctions)
which are shown hereafter :
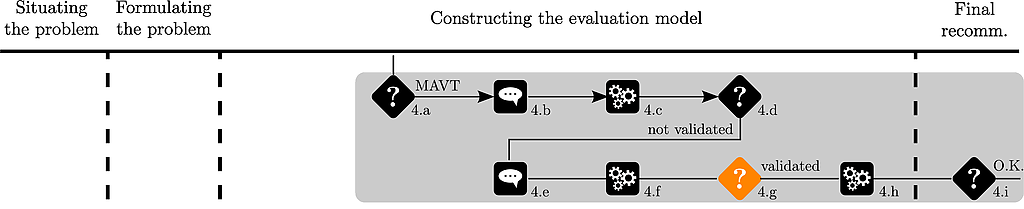
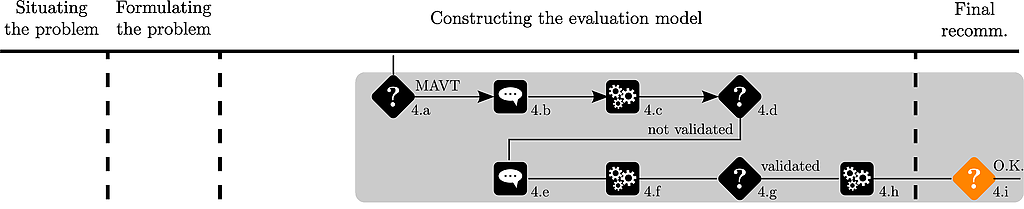
Thierry validates his preference model.
This preference model is then applied on the remaining alternatives :
# apply the value functions on the original performance table

tPT <- applyPiecewiseLinearValueFunctionsOnPerformanceTable(
                                        x2$valueFunctions,
                                        pT
                                                            )
# calculate the overall score of each alternative

mavt <- weightedSum(tPT,rep(1,5))
The overall values of the alternatives are shown to Thierry :
a01       a02       a03       a04       a05       a06       a07
0.4611504 0.5752482 0.6324617 0.4788993 0.5870830 0.6054313 0.5150286
a08       a09       a10       a11       a12       a13       a14
0.4888993 0.3334222 0.6265008 0.6850774 0.6758266 0.3434222 0.3234222
Thierry observes that a11 is ranked first.
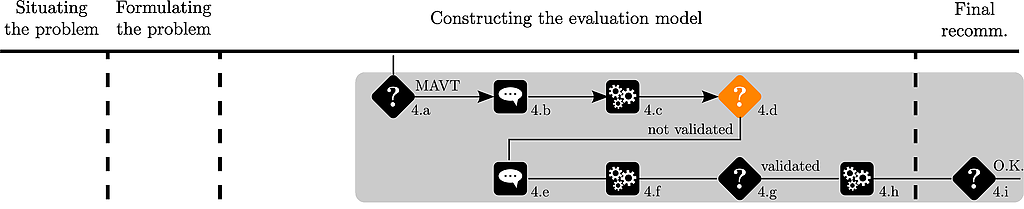
The analyst plots the ranking of the alternatives :
plotAlternativesValuesPreorder(mavt, decreasing=TRUE)
which is shown hereafter :
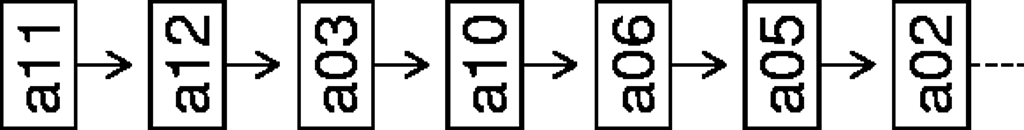
Thierry is satisfied with the recommendation, the MCDAP is stopped.
Bibliography
[Bouyssou et al., 2000] Bouyssou D, Marchant T, Pirlot M, Perny P, Tsouki`as A, Vincke P (2000) Evaluation and decision models: A critical perspective. Kluwer, Dordrecht